Flare Destruction Removal Efficiency (DRE)

Assess the destruction removal efficiency of flares with precision drone monitoring.

A step towards optimised flare performance and improved sustainability

Flaring is a major source of greenhouse gas emissions, releasing methane (CH₄) and other hydrocarbons into the atmosphere. Reducing flaring is essential not only for mitigating climate change but also for conserving valuable natural gas that can be redirected for productive use.

Measuring and understanding Destruction Removal Efficiency (DRE) of flares is therefore crucial to effective environmental management. DRE is the expression of how efficiently a flare system converts methane (CH₄) into carbon dioxide (CO₂) and other hydrocarbons during combustion. High DRE values mean lower fugitive emissions and stronger compliance with global climate and reporting frameworks such as OGMP 2.0.

But flare DRE is also difficult to measure due to the non-homogeneous nature of the flare plume. This is where Explicit can help.

Illustration showing the flare wall design used in the FlareE project

Why trust Explicit with your DRE measurements?

We have pioneered an advanced and highly accurate drone-based DRE measurement technique, built on our patented Drone Flux Measurement (DFM) Method. Using a unique multi-gas sampling approach, operators gain a precise understanding of their flare efficiency, derived from a fully measured quantitative ratio of CH₄ and CO₂ within the flare plume.

Data is collected directly from the emission plume downwind of the flare, ensuring complete interception of both gases for accurate calculations. The DFM Method is a uniquely robust in-situ sampling technique suitable for all flaring environments. It effectively overcomes layering effects caused by ignition conditions, flare design, flow rates, and environmental factors, providing operators with consistently reliable results.

Key benefits of flare efficiency measurement

Easy deployment over land and sea
Single-person set up
100% transparent methodology
No interference with site operations
High accuracy and low detection limit
ISO 17025 accredited reporting

From climate gas to emissions result

Combining sensors, software, and lab services in one integrated solution, Explicit provides a full ISO 17025-compliant service.

Flare visualisation on an area map
Site survey and sampling plan

Preliminary analysis of the site: identification of possible sources, risk zones, feasible flight paths etc. and organisation of the campaign.

Crew with drone at offshore platform
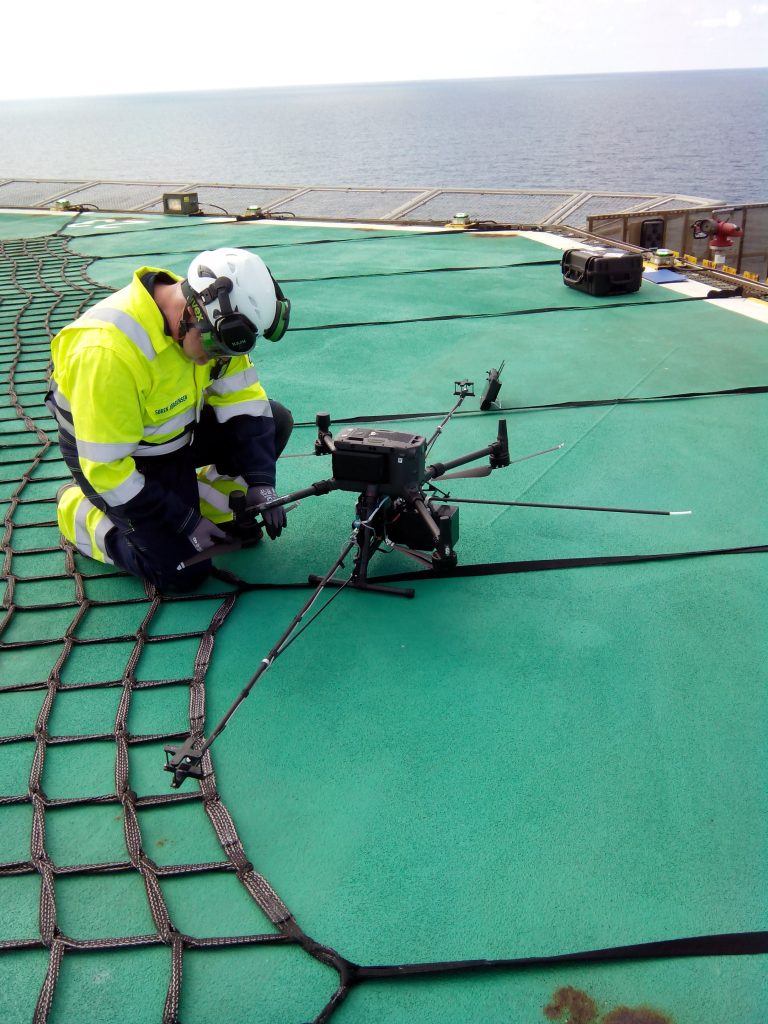
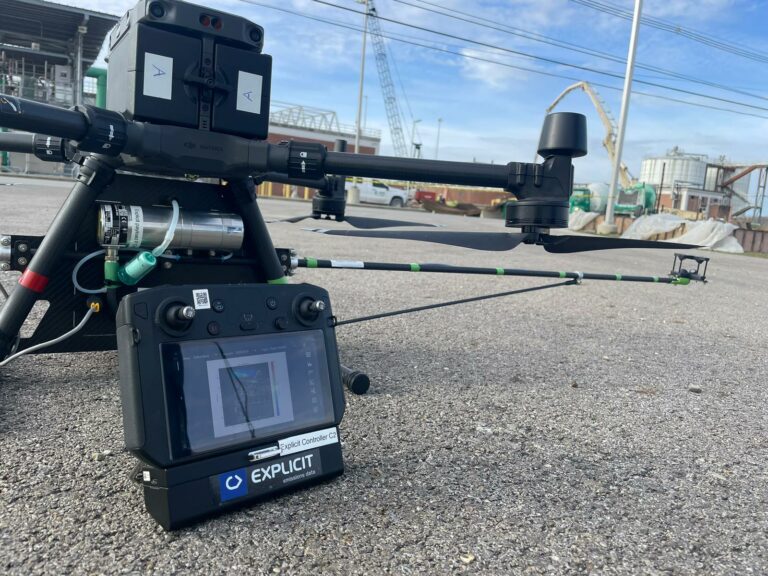
Drone set-up and data collection

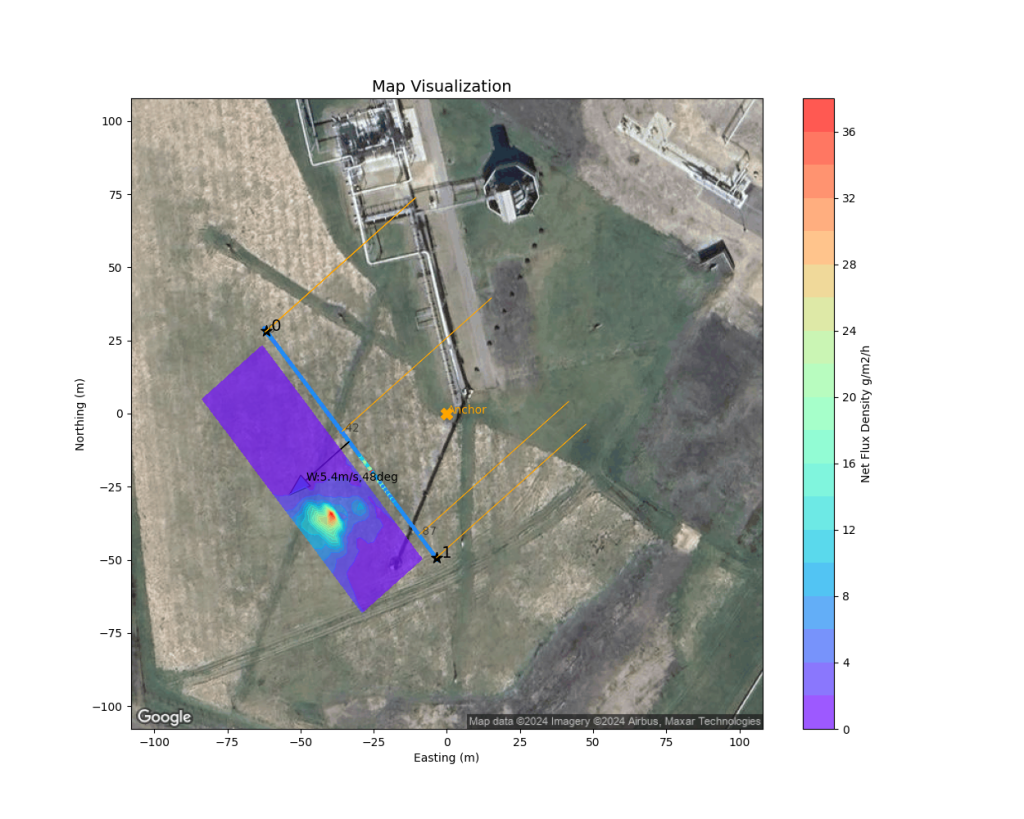
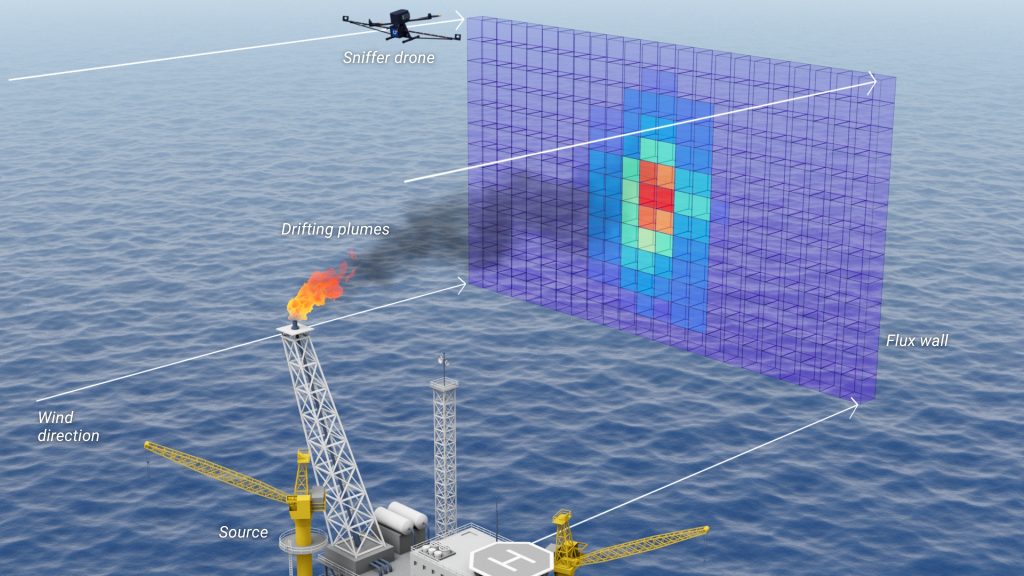
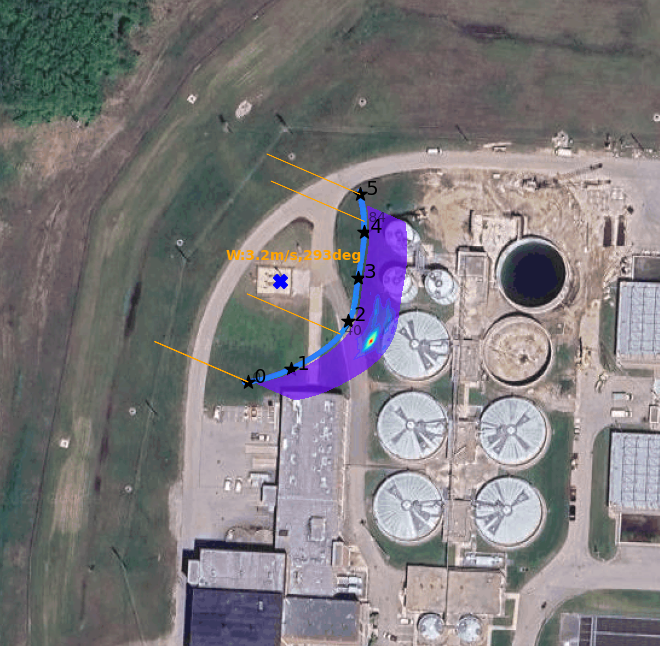
Gas and wind sensors are integrated on the drone. Through an adaptive flight pattern, the drone flies a vertical wall downwind from the site of interest, collecting thousands of data points.

Preliminary and final analysis

An automated analysis provides the pilot with real-time feedback on the flight.
Once the data collection is concluded, the analyst processes the data. Using the client's data, flow rate and gas concentration, the flare DRE assessment is created.
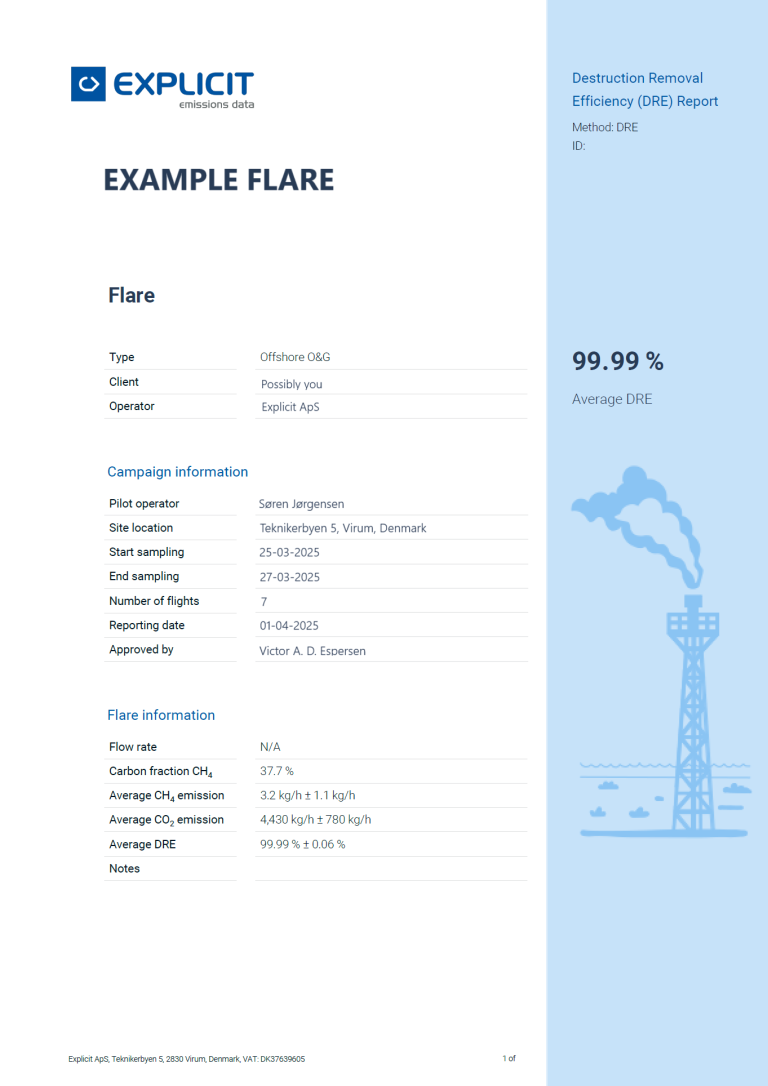
Flare Destruction Removal Efficiency Report
Emissions report

A detailed emissions report containing the average emission rates and flare destruction efficiency is presented to the client.

Project Spotlight: Flare Efficiency (FlareE)

In partnership with Equinor ASA and supported by the Energy Technology Development and Demonstration Programme (EUDP), Explicit developed and demonstrated a breakthrough methodology for measuring flare DRE using drone-based in-situ sampling.

A Flare Characterisation Protocol (FCP) was developed as part of the FlareE project, which describes a path to use spot measurements as part of annual reporting.

Where DRE measurements can be used

Oil and gas sector
Quantifying DREs for reporting and operations optimisation on both offshore and onshore platforms.
Biogas plants
Quantifying DREs to improve plant performance and sustainability.
Waste water treatment plants
Quantifying DREs to improve plant performance and sustainability.
Research
Quantifying validated datasets for academic, regulatory, or industrial studies.
Plot area map result

Visualisation of data

The flight flux density visualisation is plotted on the site map, together with the average wind direction estimated during the flight (orange lines). These visualisations are presented in the emissions report and can support the client in the detection of the sources.

Get in touch to learn more

Our patented drone technology helps a great variety of industries and authorities across six continents to measure and document their emissions. Reach out to learn how we can assist your industry in achieving its environmental targets.