At Explicit, we are committed to delivering actionable data that helps our clients make informed decisions. One of our newest developments is the support for 3D visualisations of emissions data. By working closely with clients’ digital teams, we provide measurement data in meta formats that integrate seamlessly into their existing 3D site models.
Better insights through 3D
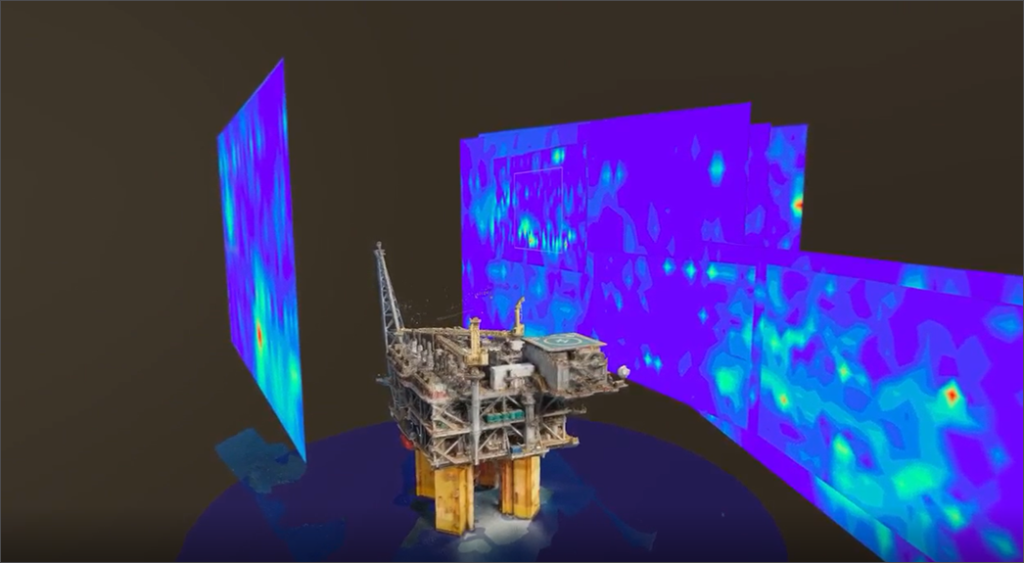
This approach makes site-level measurements much clearer. The visualisations allow clients to see emission sources within a full spatial context. The vertical perspective adds depth and clarity, helping to pinpoint sources more precisely than traditional 2D maps. Our capability supports multiple data types beyond CH₄, including wind, CO₂, and temperature, to enable accurate source allocation. 3D visualisations make it easier to identify emission hotspots, reconcile source and site-level measurements, and improve both monitoring and mitigation strategies. This technology is particularly useful in offshore environments, where illustrative maps alone can be limiting.
Case study: 3D emissions visualisation at the Shenzi platform
In 2024, Woodside Energy conducted a field deployment trial at its Shenzi platform in the Gulf of Mexico to evaluate the performance of methane measurement technologies. Explicit was among the operators participating in the study.
As part of this collaboration, we provided measurement metadata to support the 3D visualisation of methane emissions within a detailed model of the platform. This enabled emissions to be assessed directly within the asset’s spatial environment and track source origins.